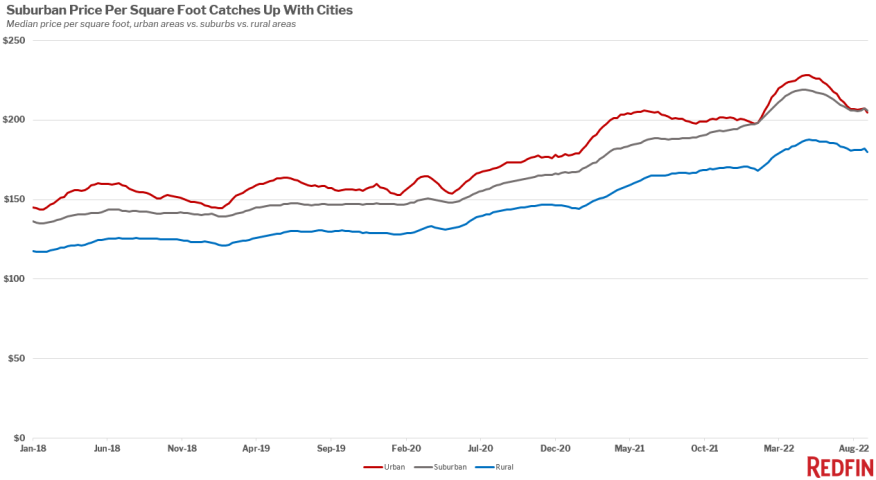
As mortgage rates escalate and home prices rapidly fall in cities, the value of a square foot in the suburbs has caught up with urban rates. That’s according to a new report from Redfin, which found that space in suburban homes was worth more than space in urban homes in September for the first time since it started tracking this data in 2018.
The data reflects the reality that prices are slowing faster in cities than in suburban areas.
The typical home in suburban neighborhoods nationwide was worth $206 per square foot during the four weeks ending September 25, slightly higher than $205 in urban neighborhoods.
With city home prices slipping the fastest, Redfin found that homes in urban areas nationwide are selling for $310,000, up 2.7% from a year earlier. That’s compared with a 6.6% increase to $385,000 in the suburbs and a 4% increase to $333,000 in rural neighborhoods. Homes are the least expensive in urban areas because they’re typically the smallest, Redfin said.
In urban neighborhoods nationwide, price per square foot increased 3.5% year over year, which is still up from a year ago but down significantly from its pandemic peak, due to the smaller urban square footage compared to suburban areas. Suburban areas experienced 9.5% growth and rural areas saw an 8.4% increase to $180 per square foot.
“Urban home prices soared in 2021 as homebuyers gravitated back to city centers as the pandemic waned and affluent Americans — motivated by record-low rates — decided they wanted the best of both worlds: Homes with plenty of space for working from home, but located in walkable areas near shops and restaurants,” said Redfin Senior Economist Sheharyar Bokhari. “Today’s buyers can’t afford everything on their wish list, so many are prioritizing space over walkability.”
Housing activity has slowed in all three neighborhood areas since the market started cooling in the spring. Home sales are down more than 15% year over year in urban, suburban, and rural areas, as many buyers are priced out of the market. Sellers have steadily pulled back, with new listings down at least 7% in all neighborhood areas.
“Urban neighborhoods will likely see prices — and price per square foot — fall on a year-over-year basis before suburbs and rural areas,” Bokhari said. “House hunters may want to shift their search to urban neighborhoods, where they may find lower prices to help counteract the costliness of today’s mortgage rates. And now that space is just as valuable in the suburbs, it’s less likely that they’ll sacrifice space.”
Redfin’s analysis also found that price per square foot has declined from a year ago in urban parts of nine of the 91 metros studied. Urban neighborhoods in the San Francisco area saw their median price per square foot decline 6.2% year over year in the 12 weeks ending Sept. 25. Even though San Francisco saw the biggest dip out of all of the metros, San Francisco homes still cost $976 per square foot — the most expensive in the U.S. by far.
San Francisco is followed by New Orleans, which saw a 6% drop to $187 per square foot, and by Philadelphia, which saw a 3.2% decline to $188.
On the flip side, prices per square foot increased most from a year ago in urban parts of Florida, especially in places hit hard by Hurricane Ian in September. Specifically, in Cape Coral neighborhoods the price per square foot rose 31.4% to $278 in the 12 weeks ending Sept. 25.