There are fewer homes for sale, but what is available is practically flying off the market, according to a new report from Redfin.
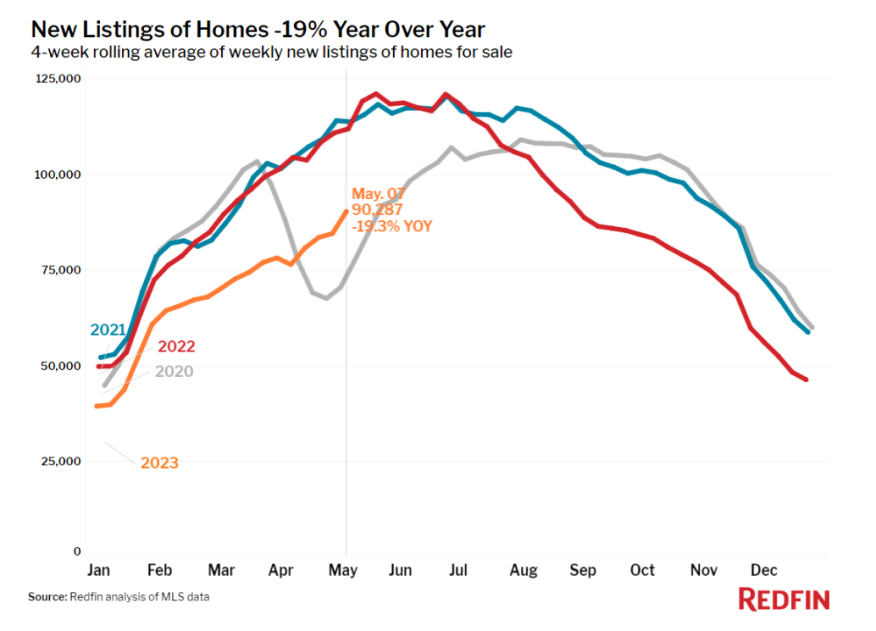
The Seattle-based digital real estate brokerage said Thursday that new listings of homes for sale were down 19% in the four weeks ended May 7 from a year earlier, helping to produce an “unseasonal” monthly decline in total inventory.
There were also 16% fewer pending home sales during the period than a year earlier, reflecting the lack of inventory. Redfin said it also shows that potential buyers have been priced out by mortgage rates above 6% and record-high monthly payments.
Over the last week, however, pending home sales have increased, which is typical for the time of year, Redfin said. Mortgage purchase applications were up 5% on a seasonally adjusted basis.
While the pool of buyers is small, they are determined — nearly half of the homes sell within two weeks, and that share has increased over the past four weeks, Redfin said.
“This spring’s housing market is hot but cold, with scant listings making it less active than usual but fast and competitive at the same time,” said Taylor Marr, Redfin’s deputy chief economist. “The good news is that buyers are out there, trying to find a seat in a game of musical chairs. The bad news is there aren’t enough chairs.”
Marr said many potential home sales are locked up until mortgage rates fall “to a level for which current owners would be willing to trade in their 3% rate. The problem is that’s unlikely to happen anytime soon, as although inflation is steadily coming down from last year’s record-high levels, it’s still above target.”
This week’s inflation report shows a slight slowdown in price gains — the consumer price index slipped to an annual rate of 4.9% in April, the slowest rate in two years — confirming that mortgage rates are likely to stay about where they are for the next several months. That’s because the Federal Reserve’s interest-rate hikes appear to be slowly bringing inflation down to its 2% goal. That means the Federal Open Market Committee is unlikely to raise or cut interest rates at its next meeting, scheduled for June 13-14.
Metro Areas
While a lack of inventory and few but fast-moving sales characterize the U.S. housing market as a whole, each metro area is unique.
Gabriel Recio, an Austin, Texas, Redfin Premier agent, said home-buying demand has picked up this spring, but there are enough homes for sale that he’s not seeing much competition. Pending sales and new listings are both down about 9% from a year earlier in Austin, smaller declines than in most metros, and prices are down the most in the country (-18% YoY).
“I’ve seen an influx of homebuyers enter the market over the last month,” Recio said. “The rejuvenation is partly because people got tired of waiting for mortgage rates to come down and partly because they feel it’s a good time to get a home without much competition. Many of today’s buyers are people moving in from other states, and some are investors.”
In Jacksonville, Fla., Redfin Premier agent Heather Kruayai says sellers are subdued — and so are many prospective buyers.
“Homeowners are locked in by low mortgage rates. They’re not selling unless they need to move for something like a new job or another major life change,” Kruayai said. “Homes that do go on the market are selling quickly if they’re low-priced starter homes, but middle-of-the-road and expensive homes are sitting.”
Leading indicators of homebuying activity:
- For the week ended May 11, the average 30-year fixed mortgage rate was 6.35%, down slightly from 6.39% the week before. It’s the second straight week of rates inching down. The daily average was 6.57% on May 10.
- Mortgage-purchase applications during the week ending May 5 increased 5% from a week earlier, seasonally adjusted. Purchase applications were down 32% from a year earlier.
- The seasonally adjusted Redfin Homebuyer Demand Index — a measure of requests for home tours and other home-buying services from Redfin agents — was up slightly from a month earlier during the week ended May 7 and down just 2% from a year earlier, the smallest annual drop in a year. Demand is barely declining from year-ago levels because buyers were backing off quickly at this time last year as mortgage rates rose above 5% for the first time since 2009.
- Google searches for “homes for sale” were little changed from a month earlier during the week ended May 6, and down about 15% from a year earlier.
- Touring activity as of May 6 was up 26% from the start of the year, compared with a 14% increase at the same time last year, according to home tour technology company ShowingTime.
Key housing market takeaways for 400+ U.S. metro areas:
Unless otherwise noted, the following data covers the four-week period ended May 7. Redfin’s weekly housing market data goes back through 2015. For bullets that include metro-level breakdowns, Redfin analyzed the 50 most populous U.S. metros. Select metros may be excluded from time to time to ensure data accuracy.
- The median home sale price was $370,625, down 2.7% from a year earlier, the 11th-straight four-week period of declines.
- Home-sale prices declined in 30 metros, with the biggest drops in Austin, Texas (-17.7% YoY), Oakland, Calif. (-15.7%), San Francisco (-11.9%), Las Vegas (-10.7%) and San Jose, Calif. (-9.7%). For Austin, it’s the biggest drop since at least 2015.
- Sale prices increased most in Fort Lauderdale, Fla. (10.6% YoY), Milwaukee (6.9%), Cleveland (6%), Indianapolis, Ind. (5.7%), and Providence, R.I. (5.3%).
- The median asking price of newly listed homes was $398,750, up just 0.5% from a year earlier.
- The monthly mortgage payment on the median-asking-price home hit a record high of $2,566 at a 6.35% mortgage rate, the current weekly average. That’s up 9.7% ($226) from a year earlier.
- Pending home sales were down 15.8% year over year.
- Pending home sales fell in all metros Redfin analyzed. They dropped most in Las Vegas (-38.7 YoY%), Seattle (-37.6%), Chicago (-34.4%), Oakland (-33.9%) and Sacramento, Calif. (-32.9%).
- New listings of homes for sale fell 19.3% year over year.
- New listings declined in all metros Redfin analyzed. They dropped most in Riverside, Calif. (-48.7% YoY), Anaheim, Calif. (-48.6%), Los Angeles (-40.6%), San Diego (-39%), and Las Vegas (-38.6%).
- Active listings — the number of homes listed for sale at any point during the period — were up 3.6% from a year earlier, the smallest increase since June. Active listings fell about 1% from a month earlier; typically, they post month-over-month increases at this time of year.
- Months of supply — a measure of the balance between supply and demand, calculated by the number of months it would take for the current inventory to sell at the current sales pace — was 2.6 months, up from 1.9 months a year earlier. Four to five months of supply is considered balanced, with a lower number indicating seller’s market conditions.
- 48% of homes that went under contract had an accepted offer within the first two weeks on the market, down from 51% a year earlier but up from 46% a month earlier. Typically, month-over-month declines are common at this time of year.
- Homes that sold were on the market for a median of 32 days, the shortest span since September and up from 19 days a year earlier, which was close to the record low.
- 32% of homes sold above their final list price, the largest share since September, but down from 54% a year earlier.
- On average, prices dropped on 5% of homes for sale each week, up from 3.1% a year earlier.
- The average sale-to-list price ratio, which measures how close homes are selling to their final asking prices, was 99.4%, the highest level since September but down from a record 102.6% a year earlier.