In the first quarter of 2022, it was the best of times for homeowners, and the worst of times for homebuyers.
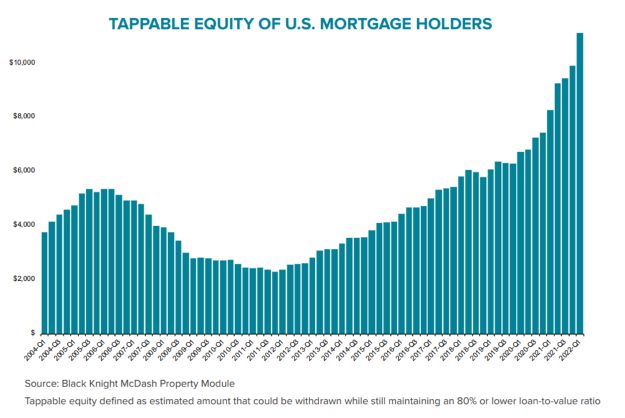
As home prices and interest rates continue to rise, mortgage holders have seen their tappable equity — the amount available for them to borrow against while retaining a 20% equity stake in their homes — reach another all-time high in the first quarter of this year.
That’s according to the Data & Analytics division of Black Knight Inc., which today released its monthly Mortgage Monitor Report, based on the company’s mortgage, real estate, and public records datasets.
U.S. mortgage holders saw their collective tappable equity increase by $1.2 trillion in first quarter of 2022 alone — the largest quarterly increase ever — and over the past 12 months have gained $2.8 trillion, a 34% increase that equates to more than $207,000 in equity available per borrower, Black Knight said.
At the same time, however, those rising home prices and interest rates, combined with the short supply of homes for sale, made May the worst housing market for homebuyers in 16 years, Black Knight said.
U.S. home prices are up 42% since the start of the pandemic, with the average home having gained almost 9% in value just since the start of 2022. Though the annual rate of appreciation cooled slightly — to 19.9% in April vs. an upwardly revised 20.4% for March — rising home prices and interest rates have made for the worst affordability since July 2006
According to Black Knight, the monthly principal and interest (P&I) payment on the average-priced home with 20% down is nearly $600, 44% more than it was at the start of the year and $865, or 79%, more than before the pandemic.
As of May 19, with 30-year mortgage rates at 5.25%, the share of median income required to make that principal and interest payment had climbed to 33.7%, just shy of the 34.1% high reached in July 2006.
“Home price growth cooled — albeit very slightly — in April,” Black Knight Data & Analytics President Ben Graboske said. “While a downward shift from 20.4% to 19.9% annual growth is hardly cause for concern, it’s also likely we've not yet seen the full impact of recent rate increases.”
“Rather,” Graboske continued, “April’s decline is more likely a sign of deceleration caused by the modest rate increases in late 2021 and early 2022 when rates first began ticking upwards. The March and April 2022 rate spikes will take time to show up in repeat sales [indices]. That said, price growth thus far has created a very difficult environment for prospective homebuyers to navigate.”
With the increase in the monthly P&I payment since the start of the year, housing is now within a whisper of the record-low affordability seen at the peak of the market in 2006, he said, adding that even modest increases in either interest rates or home prices at this point would push affordability over that line.
“It really is a bifurcated landscape — one that grows ever more challenging for those looking to purchase a home, but is simultaneously a boon for those who already own and have seen their housing wealth rise substantially over the last couple of years,” Graboske said. “Depending upon where you stand, this could be the best or worst of all possible markets.”
The Mortgage Monitor also looked at another key contributing factor to both home prices and affordability — record-low for-sale inventories. Despite seeing an increase of 27,500 from March to April, active listings remain 67% below pre-pandemic levels, with 820,000 fewer listings than would be typical at this point in most homebuying seasons.
New listing volumes were up 1% from the same time last year, but remained 11% below pre-pandemic levels for the month of April, suggesting that the number of homes hitting the market remains well below what would be considered “normal” levels, Black Knight said.
The ongoing lack of supply continues to weigh on home sales and keep prices higher than they might otherwise be given current affordability metrics, Black Knight said. In recent years, a 20.5% payment-to-income ratio has been a rough tipping point at which appreciation begins to soften, but given the severity of inventory shortages, home prices continue to rise — even as that P&I ratio has climbed to 33.7%, just shy of the 34.1% high reached in July 2006.
The Data & Analytics division of Black Knight manages a repository of loan-level residential mortgage data and performance information covering the majority of the overall market, including tens of millions of loans across the spectrum of credit products and more than 160 million historical records.
The combined insight of the Black Knight HPI and Collateral Analytics’ home price and real estate data provides one of the most complete, accurate, and timely measures of home prices available, covering 95% of U.S. residential properties down to the ZIP-code level. In addition, the company maintains one of the most robust public property records databases available, covering 99.9% of the U.S. population and households from more than 3,100 counties.