The spring homebuying season continues to defy historical norms, with elevated interest rates and low inventory causing “gridlock” in the housing market, Black Knight said Monday.
The company’s latest Mortgage Monitor Report, released today by Black Knight Inc.’s Data & Analytics division, finds that each of the 100 largest U.S. markets is once again less affordable than its own long-term average
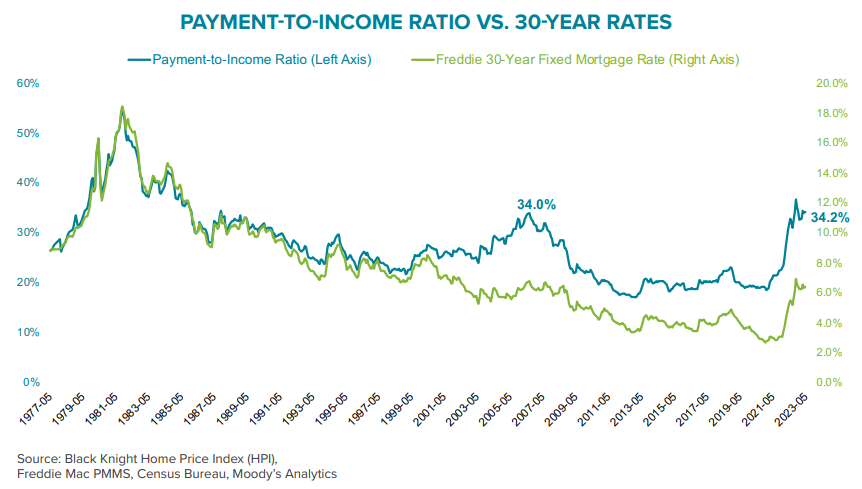
In addition, nationwide it now takes 34.2% of median household income — $2,256 — to make monthly principal and interest (P&I) payments on the median-priced home purchased with 20% down using a 30-year fixed-rate mortgage, the company said. The dollar amount is the highest required P&I payment on record, surpassing even the $2,238 needed on average last November, Black Knight said.
At 34.2% of median household income, however, the percentage has held effectively flat over the past three months, and only modestly better than the 36.8% the ratio hit last fall when 30-year rates were at 7%. Black Knight said the higher payment amount but lower ratio to median household income is a result of incomes rising nationwide since November.
Optimal Blue rate lock data from Black Knight also found that, after pulling within 15% of pre-pandemic levels on rate dips earlier this year, purchase activity fell back in recent weeks to a 34% deficit, thanks to shrinking demand.
Rising borrower credit scores and down payments among recent rate locks also point to the tightening of credit availability, which compounds the challenges facing potential homebuyers.
“In a sense, the gridlocked housing market has been feeding on itself,” said Andy Walden, vice president of enterprise research at Black Knight. “While elevated interest rates continue to weigh on both affordability and demand, they’re simultaneously constricting supply as well as would-be sellers who locked in ultra-low rates early in the pandemic and continue to sit on the sidelines.”
Walden said the combination of lower supply and demand in April led to both slowing sales and firming prices.
“In fact, while home sales dipped, April marked the fourth consecutive month of home-price gains, which are now almost universally rising across the country again on a seasonally adjusted basis,” he said. “Only Austin, Texas — the sole market where inventory is back above pre-pandemic levels — is still seeing meaningful price corrections continuing into the spring. In today's market, interest rates are acting as a double-edged sword — reducing or increasing both demand and supply as they rise and fall, making it challenging to find a rate-driven path to easing affordability and home prices.”
Tightening Credit
In addition to all of that, credit availability continues to tighten, Walden said.
“Our Optimal Blue rate lock data shows that average credit scores and down payments are on the rise, with tightening credit compounding the significant challenges already facing potential home buyers and the origination market alike,” he said.
According to Black Knight’s McDash loan-level mortgage performance dataset, April purchase credit scores were the highest on record, dating back to 2000, when Black Knight first started tracking the metric. Pullbacks in purchase rate lock volumes have continued, dropping 11% from the week ending March 25 to the week ending May 20, in what would typically be the heart of the homebuying season, he said.
“Indeed, purchase locks have fallen back down to more than 30% below pre-pandemic levels,” Walden said. “Demand is obviously suffering, and the fact that this spring’s strengthening home prices have erased more than 60% of the ‘correction’ seen late last year isn’t likely to help much on that front.”
Location, Location, Location
The Mortgage Monitor Report also found that, on the West Coast, where inventory levels have pulled back again this spring, prices have begun to rise again, reversing some of the correction in prices from late last year.
San Jose, Calif. — among the metros that saw the largest price corrections in 2022 — ranked in the top 20% of markets in terms of single-month seasonally adjusted price gains in April (+0.8%), while San Diego prices were up by 0.9% and Seattle by +0.7% in the month.
Hartford, Conn. — the market with the largest inventory deficit nationwide, with 81% fewer active listings compared to pre-pandemic levels — experienced the largest single-month price gains (+1.3%), followed by Milwaukee (+1.2%), Detroit (+1.1%), Cleveland (+0.9%) — the most affordable market compared to its long-run average – Columbus, Ohio (+.9%), and Boston (+.9%).
If sustained, the report states, Hartford’s monthly gains would equate to an annual home price growth rate of 15.3%, again sparking the risk of a reheating housing market should inventory shortages persist.
Other Report Highlights:
- Black Knight Collateral Analytics data showed home sales volumes fell in April, as a lack of both affordability and inventory continue to create major market headwinds
- Having worsened in eight of the past nine months on a seasonally adjusted basis, for-sale inventory is now at its lowest level since April 2022, with inventory deteriorating in 95% of major markets since the start of 2023
- The inventory decline continues to put upward pressure on home prices this spring, with April marking the fourth-consecutive monthly increase on a seasonally adjusted basis
- April’s seasonally adjusted +0.46% increase was roughly on par with the 30-year average of +0.48% for the month, and would equate to a 5.5% annualized growth rate if sustained for a 12-month period
- Despite prices firming, annual growth slipped to 0.0% in April – marking the first time home prices have been flat year over year since the market began to recover in the wake of the Great Financial Crisis
- Price strengthening this spring has erased more than 60% of the declines seen late last year at the national level, and at the current rate of growth would fully erase those corrections by mid-2023
- At 3.31%, the national mortgage delinquency rate increased 39 basis points (bps) in April, up 2.1% year over year.