Polygon Research and Homeownership Council of America has released a new analysis showing the U.S. states with the largest and smallest homeownership gaps by race and ethnicity compared to the statewide homeownership rate.
Homeownership is the number one driver of wealth, and ensuring equal access to it remains crucial to economic stability, according to the homeownership council. Yet, the analysis shows there hasn’t been much progress within the past few decades, as the gap between white and Black homeownership is nearly the same today as it was in the 1970s when the Fair Housing Act (FHA) and Equal Credit Opportunity Act (ECOA) were enacted.
Similarly, the Community Reinvestment Act (CRA), enacted in 1977 to encourage banks to invest in low-income communities, also has not brought more parity to homeownership in race and ethnicity as previously hoped.
“The need to fill the gap is especially pressing in a time when home costs are rising and the supply is not keeping pace with the demand. Ensuring communities of color attain homeownership as soon as possible provides them with the most equity gain,” said Gabe del Rio, CEO and president of Homeownership Council of America. “We are prioritizing our work in Special Purpose Credit Programs based on this information. We want to share it widely with the industry so others can establish SPCP programs as well.”
Polygon Research used its product CensusVision, which compiles information from the U.S. Census Bureau's 2019 one-year American Community Survey (ACS). Polygon’s methodology compares race and ethnicity with the state’s overall homeownership rate at the household level.
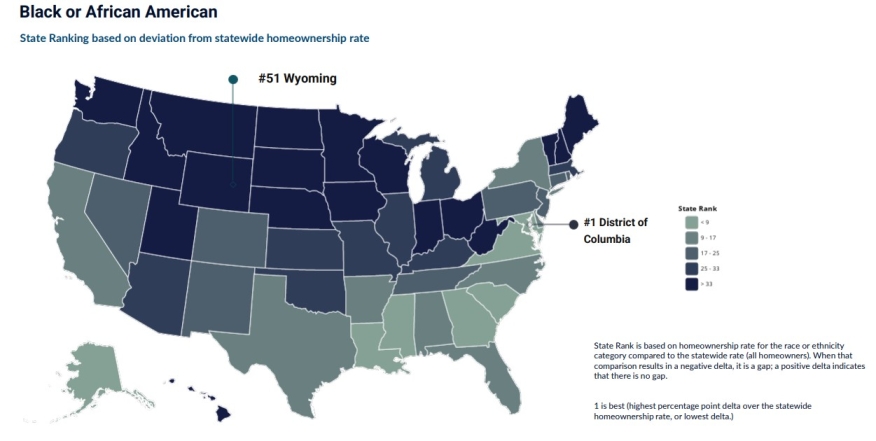
Following are the state rankings based on deviation from statewide homeownership, listed from the largest gaps to the smallest:
- District of Columbia
- Alaska
- Maryland
- Mississippi
- Georgia
- Louisiana
- South Carolina
- Virginia
- Alabama
- California
- Florida
- Arkansas
- North Carolina
- Texas
- New York
- Delaware
- Colorado
- Tennessee
- Connecticut
- New Jersey
- New Mexico
- Rhode Island
- Nevada
- Pennsylvania
- Massachusetts
- Oregon
- Illinois
- Oklahoma
- Kentucky
- Missouri
- Michigan
- Arizona
- Kansas
- Ohio
- West Virginia
- Indiana
- Washington
- Idk
- Nebraska
- Vermont
- Maine
- Wisconsin
- Montana
- South Dakota
- Minnesota
- New Hampshire
- Utah
- Idaho
- Iowa
- North Dakota
- Wyoming