Advertisement
Affordable Homeownership Options Become More Expensive

Affordable homeownership options became more elusive commodity last month, according to new data from Redfin that found prices for the most affordable third of homes sold in June were up 8.7 percent annually, the second-biggest increase in more than a year.
Only three metro areas tracked by Redfin saw price declines on their most affordable homes: San Jose with a 3.8 percent annual drop to an average of $731,688 in June, California’s Orange County with a 2.6 percent year-over-year slide to an average of $449,390, and Memphis with a 6.6 percent year-over-year tumble to an average of $78,808.
"Now that the economic expansion is in its 10th year, some working- and middle-class Americans are finally starting to see wage increases significant enough to ready them buy their first homes," said Redfin Chief Economist Daryl Fairweather. "But economic growth is a double-edged sword for the housing market. The increase in demand for low- and moderately priced starter homes is pushing up prices for the most affordable segment of the market. Over the next few years, prices for the most affordable homes are likely to continue growing rapidly, pushing homeownership further out of reach for people with lower incomes."
Redfin also noted that prices on homes in the most expensive third grew by a mild 1.1 percent year-over-year. The supply offering for the affordable and luxury sectors was also significant: Supply was down 14.5 percent year-over-year in June for the affordable tier but was up by 9.7 percent for the most expensive tier. Supply has been rising on a year-over-year basis for the luxury tier since mid-2013 but has been dropping for the affordable tier since at least 2012, often by double digits.
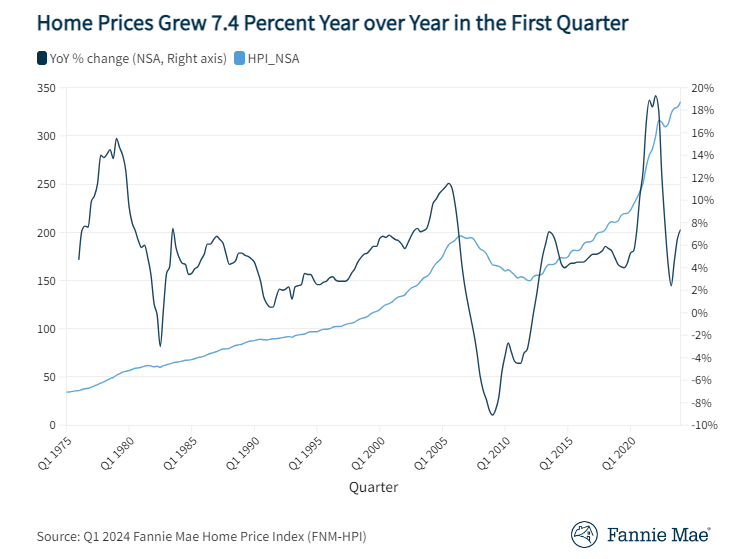
Separately, the Federal Housing Finance Agency (FHFA) reported that home prices in May were up 0.1 percent from the previous month and up five percent from one year earlier. For the nine census divisions, the FHFA found the seasonally adjusted monthly house price changes from April to May ranged from -1 percent in the East South Central division to +0.5 percent in the South Atlantic division while the 12-month changes were all positive, ranging from +3.6 percent in the West South Central division to +6.7 percent in the Mountain division.
About the author


