Homes are selling at the slowest pace since the housing market nearly ground to a halt at the beginning of the pandemic, according to a new report from Redfin.
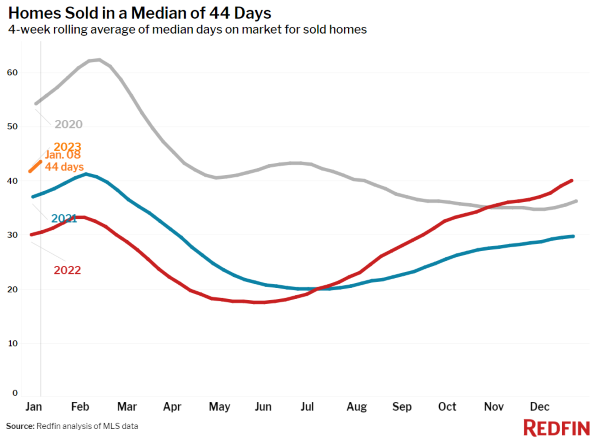
The digital real estate brokerage said Friday the typical home that sold during the four weeks ended Jan. 8 was on the market for 44 days, the longest since April 2020, contributing to the biggest annual inventory increase on record.
Pending home sales, meanwhile, plunged 32% year over year to their lowest level on record, while mortgage-purchase applications dropped to their lowest level since 2014.
High mortgage rates and extreme winter weather at the start of 2023 deterred would-be homebuyers, exacerbating the typical holiday slowdown. There are signs, however, that early-stage demand is up, Redfin said.
The company’s Homebuyer Demand Index — a measure of tour requests and other buying services from Redfin agents — increased 6% over the past month, and Google searches for “homes for sale” also are rising.
Some buyers are likely coming in from the sidelines, Redfin said, because mortgage rates have dropped to 6.33% from their November peak of over 7%, saving the typical U.S. homebuyer about $250 on monthly housing payments. Buyers may also be encouraged by signs of improvement in the economy, with inflation easing in December for the sixth month in a row as wage growth softens, Redfin said.
“We’re entering 2023 with positive economic news: The latest consumer price index report confirms that the worst of inflation is behind us. That means the Fed is likely to continue easing its interest-rate increases, which should cause mortgage rates to continue gradually declining. This could bring back some homebuyers in the coming months,” said Redfin Deputy Chief Economist Taylor Marr. “We’ve already seen an uptick in people initiating home searches. Although those house hunters haven’t yet turned into buyers, they may soon, given that monthly mortgage payments are notably down from their peak and the latest inflation and employment data lower the chances of a recession.”
The state of the market has changed so dramatically over the past year that Rocket Cos. CEO Jay Farner told CNN that the days of sellers holding all the power are over.
“Those moments of … there are 20 offers coming in are gone now," he told CNN. "Buyers can take a bit more time. The buyer has a little bit more power or control on their side.”
Home Prices Fell in 40% of Metros
The typical U.S. home sold for $351,250 during the four weeks ended Jan. 8, up 0.8% from a year earlier, but down about 10% from the June peak.
Home-sale prices fell year over year in 20 of the 50 most populous U.S. metros. By comparison, 11 metros saw year-over-year price declines a month earlier.
Prices fell 10.6% year over year in San Francisco; 5% in Seattle; 4.9% in San Jose, Calif.; 4% in Austin, Texas; 3.8% in Detroit; 3.7% in Phoenix; 3.4% in Oakland, Calif.; 3% in Boston; 3% in Los Angeles; 3% in Sacramento, Calif.; 2.6% in San Diego; and 2.5% in Chicago. They fell 2% or less in Portland, Ore.; Anaheim, Calif.; Riverside, Calif.; Newark, N.J.; New York; Pittsburgh; Las Vegas; and Washington, D.C.
This marks the first time Las Vegas prices have dropped year over year since at least 2015, Redfin said. It’s also the biggest year-over-year price drop in San Francisco, Seattle, Phoenix, Chicago, Boston, Portland, and San Diego since at least 2015.
Key Highlights:
- For the week ended Jan. 12, 30-year mortgage rates declined from the week before to 6.33%. The daily average was 6.15% on Jan. 11.
- Mortgage-purchase applications during the week ended Jan. 6 declined 1% from a week earlier, seasonally adjusted, hitting their lowest level since 2014. Purchase applications were down 44% from a year earlier.
- The seasonally adjusted Redfin Homebuyer Demand Index — a measure of requests for home tours and other homebuying services from Redfin agents — was essentially flat from a week earlier and up 6% from a month earlier during the four weeks ended Jan. 8. It was down 29% from a year earlier.
- Google searches for “homes for sale” were up nearly 50% from their November low during the week ended Jan. 7, but down about 17% from a year earlier.
Key Metro Takeaways
Unless otherwise noted, this data covers the four-week period ended Jan. 8. Redfin’s weekly housing market data goes back through 2015.
- The median home sale price was $351,250, up 0.8% year over year.
- The median asking price of newly listed homes was $352,150, up 3.9% year over year.
- The monthly mortgage payment on the median-asking-price home was $2,263 at the current 6.33% mortgage rate. That’s roughly flat from a week earlier and down $244 from the October peak. Monthly mortgage payments are up 32.7% from a year ago.
- Pending home sales were down 31.7% year over year to the lowest level on record, the 12th straight period of pending sales declining more than 30%.
- Among the 50 most populous U.S. metros, pending sales fell the most in Las Vegas (-61.9% YoY); Jacksonville, Fla. (-57.4%); Phoenix (-56.9%); Austin(-55.3%); and Nashville, Tenn. (-50.8%).
- New listings of homes for sale fell 21.9% year over year.
- Active listings (the number of homes listed for sale at any point during the period) were up 20.7% from a year earlier, the biggest annual increase since at least 2015.
- Months of supply — a measure of the balance between supply and demand, calculated by dividing the number of active listings by closed sales — was 3.8 months, up from 3.4 months a week earlier and 1.9 months a year earlier.
- 27% of homes that went under contract had an accepted offer within the first two weeks on the market, down from 34% a year earlier.
- Homes that sold were on the market for a median of 44 days, the longest since April 2020. That’s up nearly two weeks from 31 days a year earlier and the record low of 18 days set in May.
- 22% of homes sold above their final list price, down from 40% a year earlier and the lowest level since March 2020.
- On average, 4% of homes for sale each week had a price drop, down sharply from 5.7% a month earlier.
- The average sale-to-list price ratio, which measures how close homes are selling to their final asking prices, fell to 97.9% from 100.1% a year earlier. That’s the lowest level since March 2020.