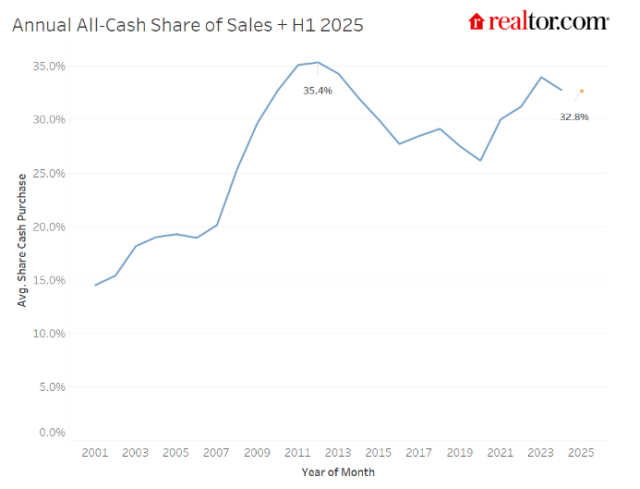
While affordability remains top of mind for many potential buyers in today’s marketplace, a new report from Realtor.com found that nearly one in three homes sold in the first half of 2025 were bought entirely with cash.
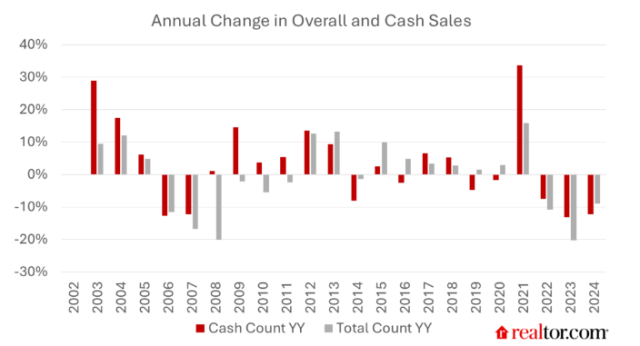
Nationwide, 32.8% of home sales in the first half of 2025 were all-cash transactions. That share is down slightly from 2024, but remains above pre-pandemic norms, when cash averaged just 28.6% of sales. Cash buying of U.S. homes surged during the pandemic, as investors competed for scarce listings, and it remains a powerful factor even as the market has cooled.
"Cash buyers have long been a fixture in the market, but their influence is more pronounced today than in pre-pandemic years," said Danielle Hale, chief economist at Realtor.com. "High-wealth buyers, investors, and those with significant equity can move quickly and often win out in competitive situations. For traditional, mortgage-reliant buyers, this can add another hurdle in an already challenging affordability environment."
Finding a Target Market
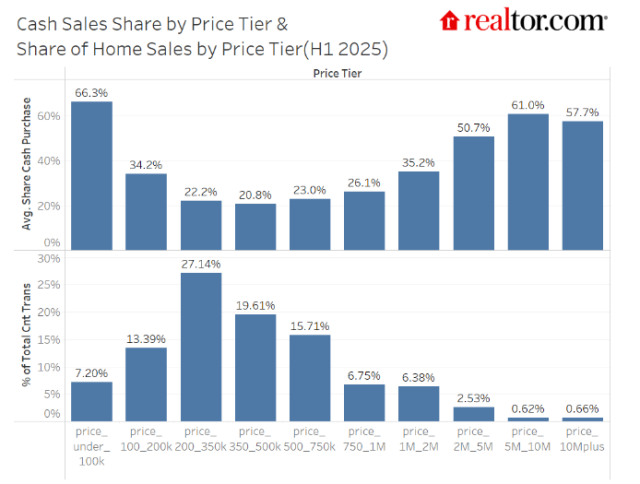
According to Realtor.com, cash dominated at the extremes of the market, with two-thirds of homes under $100,000, and more than 40% of homes over $1 million bought with cash, with the share topping 50% for homes above $2 million. This U-shaped pattern likely reflects investor activity, less access to financing, or credit barriers at the low end, and wealth concentration at the high end.
Older households and buyers with significant equity are especially likely to purchase without a mortgage, often using proceeds from a prior home sale. High-wealth buyers, meanwhile, are less influenced by borrowing costs and more likely to decide between cash and financing based on broader financial considerations.
Where Is Cash King?
Mississippi (49.6%), New Mexico (48.8%), Montana (46.0%), Idaho (45.0%), and Hawaii (44.9%), all topped the list for all-cash share in the first half of 2025. Those five were followed by:
- Maine (44.4%)
- Missouri (43.3%)
- Wyoming (41.4%)
- Indiana (41.1%)
- New York (40.9%)
In Mississippi, the high share of case sales reflects the state's lower home prices, and more limited access to credit in some rural areas. Zillow reports the average Mississippi home value is $187,882, up 0.9% over the past year.
By contrast, Hawaii and Maine attract affluent second-home buyers, many of them older and equity-rich. Meanwhile, Montana and Idaho have seen elevated shares as out-of-state buyers compete for homes.
Among metros, Miami, Florida (43.0%); San Antonio, Texas (39.6%); Kansas City, Kansas (39.2%); Birmingham, Alabama (38.8%); Houston, Texas (38.8%); and St. Louis, Missouri (38.1%) led the nation in cash share for the first half of 2025. These markets reflect different drivers, from international and high-end demand in Miami and Houston, to investor and affordability dynamics in San Antonio, Birmingham, Kansas City, and St. Louis.
By contrast, younger, high-cost, job-centered markets such as Seattle, Washington (17.9%); San Jose, California (20.6%); Denver, Colorado (20.7%); and Washington, D.C. (21.5%) saw the lowest cash shares, and in many of these areas, large shares of current homeowners have mortgage debt, suggesting more sensitivity to mortgage rate trends.
YoY Shifts Highlight Changing Dynamics
West Virginia (+5.3%), New Mexico (+4.0%),Texas (+2.8%), and New York (+2.0%) posted the largest increases in cash share, fueled by low-price investor activity, in-migration of wealthier households, and rebounding luxury demand. By contrast, Hawaii (-4.0%), New Hampshire (-3.7%), and North Dakota (-3.6%) saw the sharpest declines as luxury activity cooled or more mortgage-dependent buyers returned to the market. Texas metros, in particular, saw some of the biggest year-over-year gains, fueled by in-migration, institutional buyers, and renewed investor activity.
"Cash sales underscore the wealth concentration shaping today's housing market," said Realtor.com Senior Economic Research Analyst Hannah Jones. "If mortgage rates fall, we could see financed buyers regain ground, but for now, cash remains a powerful competitive advantage."
If mortgage rates decline in 2026, the balance between cash and financed buyers could shift drastically, as lower borrowing costs would likely draw more traditional, mortgage-dependent buyers back into the market. Cash buyers would no longer represent such a dominant share of overall sales, and the cash share could begin to ease from its current elevated levels. A shift in the rate market could also force some investors out of the market as well.
For its analysis, Realtor.com used deed records dating back to 2001 to measure the prevalence of all-cash home purchases. A sale is classified as "all-cash" when the recorded transaction shows no evidence of a mortgage lien at closing. Shares are calculated as the number of all-cash transactions divided by the total number of home sales in a given geography and time period. Results are reported at the national, state, and metro levels, and are aggregated by calendar year or half-year for trend comparability.