Housing payments hit a record high this week as mortgage rates jumped above 7% due to progress on a possible debt-ceiling deal, Redfin said Thursday.
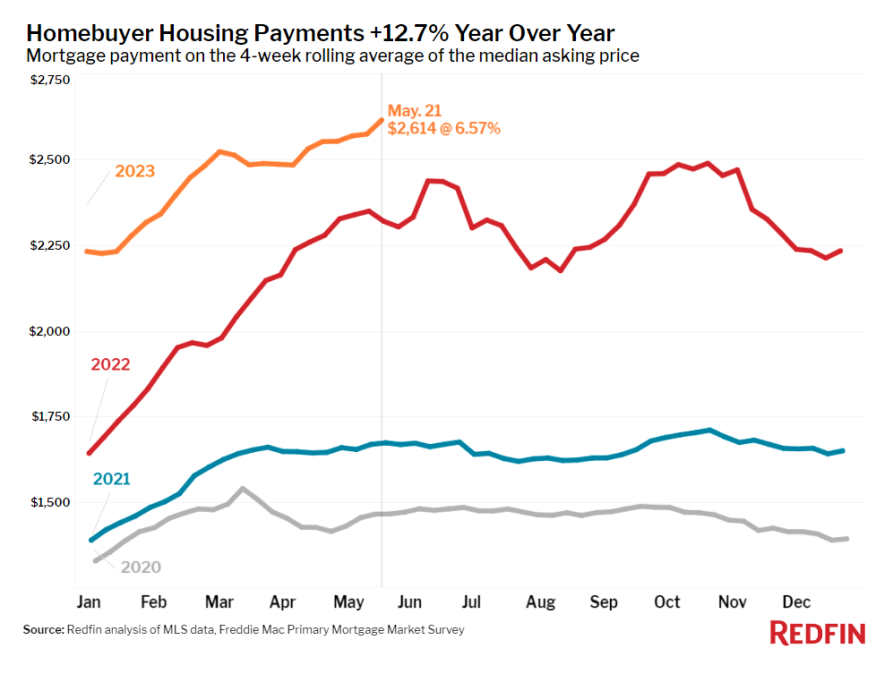
The digital real estate brokerage reported that daily average mortgage rates hit 7.12% Thursday, reaching a level not seen since November. The typical U.S. homebuyer’s monthly mortgage payment hit a record-high of $2,614 at a 6.57% mortgage rate, the current weekly average, Redfin said.
The rate increase dampened home-buying demand. Pending home sales dropped 17.4% nationwide from a year earlier during the four weeks ended May 21, the second-biggest dip since January, behind only the 17.5% decline in early April. Mortgage-purchase applications also declined, falling 4% from the previous week, Redfin said.
Potential sellers continued to hold off, with new listings of homes for sale dropping 24%, one of the biggest declines since May 2020. Homeowners continue to balk at selling because they are locked in by their existing mortgage’s lower rates. Even though demand is down, it’s still outpacing supply as the new-listing drought has caused the total number of homes for sale to post a year-over-year decline of 0.9%, the first decline in nearly a year.
Despite rates spiking above 7% and the lack of new listings, many early-stage homebuyers remain committed, Redfin said. Redfin’s Homebuyer Demand Index, which measures requests for tours and other services from Redfin agents, increased from a week earlier and is essentially flat (-1%) from a year earlier. Some of these house hunters are likely to continue their search, while others may wait for rates to fall before securing loans.
"People may be wondering why rates are surging as we come up against a potential debt crisis,” said Redfin Economics Research Lead Chen Zhao. “Right now, the way investors are reacting is the driving force.”
He continued, “Mortgage rates have increased over the past two weeks because it looks more likely that the U.S. government will avoid hitting the debt ceiling. That may seem counterintuitive, but optimism is driving rates up because an economic crisis would lead to the Fed lowering rates as they try to prevent a recession. Financial markets felt the risk of default was unusually high for the last month or so, which caused rates to stay lower than they otherwise would have been. Now that Democrats and Republicans have come to the negotiating table and are making some progress toward a deal, rates are going up.”
Tale Of 2 Budgets
In the Seattle area, different buyers are reacting differently to mortgage rates topping 7%, the company said.
Redfin Premier agent Hal Bennett, who works with buyers and sellers in pricey eastside suburbs like Bellevue and Sammamish, said buyers are shying away this week as rates rise. But Bliss Ong, a Redfin Premier agent who works mainly in Seattle, says the 7% number doesn't present the same psychological barrier for her buyers that it did back in the fall 2022.
"Rates hitting 7% is pushing some home buyers entirely out of the market, especially those with lower budgets,” Ong said. “But a lot of them are just pushing their price range down. The 7% number isn’t scaring away buyers as much as it did back in the fall. The housing market is different now because buyers are used to rates in the 6% range, and some of them are even motivated to secure a loan now in case rates rise further."
Jacksonville, Fla., Redfin Premier agent Heather Kruayai reports that, in her area, it’s the most expensive homes that are most popular in today’s market.
“Affordable listings are getting stale, but expensive ones are selling quickly,” Kruayai said. ”That’s usually because those buyers can lessen the impact of high rates by making huge down payments or paying in all cash. Other than cash buyers moving in from out of town, the only people buying and selling are the people who need to because they’re retiring or going through another major life change.”
Leading indicators of homebuying activity
- For the week ended May 25, the average 30-year fixed mortgage rate was 6.57%, up from 6.39% the week before. That’s the biggest weekly jump since February. The daily average hit 7.01% on May 23 and 7.12% — the highest level since November — on May 25.
- Mortgage-purchase applications during the week ended May 19 decreased 4% from a week earlier, seasonally adjusted, hitting their lowest level in 11 weeks. Purchase applications were down 30% from a year earlier.
- The seasonally adjusted Redfin Homebuyer Demand Index — a measure of requests for home tours and other home-buying services from Redfin agents — was up from a week earlier and essentially unchanged from a month earlier during the week ended May 21. It was down just 1% from a year earlier, the smallest decline in a year.
- Google searches for “homes for sale” were down slightly from a month earlier during the week ended May 20, and down about 13% from a year earlier.
- Touring activity as of May 20 was up 23% from the start of the year, compared to a 10% increase at the same time last year, according to home tour technology company ShowingTime. The fact that the jump is bigger so far in 2023 than 2022 reflects homebuying demand dampening around this time last year as mortgage rates rose.
Key housing market takeaways
Unless otherwise noted, the data covers the four-week period ended May 21. Redfin’s weekly housing market data goes back through 2015. For bullets that include metro-level breakdowns, Redfin analyzed the 50 most populous U.S. metros; select metros may be excluded from time to time to ensure data accuracy.
- The median home sale price was $375,750, down 2.2% from a year earlier, the smallest decline in nearly two months. Prices are up about 8% from the start of the year, a typical seasonal increase.
- Home-sale prices declined in 29 metros, with the biggest drops in Austin, Texas (-18.3% YoY); Oakland, Calif. (-15.9%); Las Vegas (-10.4%); San Francisco (-10.3%); and Sacramento, Calif. (-8.8%).
- Sale prices increased most in Cincinnati (8.5%); Milwaukee (8.1%); Fort Lauderdale, Fla. (6.8%); Newark, N.J. (6.7%); and Columbus, Ohio (4.8%).
- The median asking price of newly listed homes was $398,975, down 0.2% from a year earlier.
- The monthly mortgage payment on the median-asking-price home hit a record high of $2,614 at a 6.57% mortgage rate, the current weekly average. That’s up 13% ($265) from a year earlier.
- Pending home sales were down 17.4% year over year, the second-biggest decline since January. The biggest was a 17.5% decline during the four weeks ended April 16.
- Pending home sales fell in all metros Redfin analyzed. They declined most in Seattle (-33.1% YoY); San Diego (-32.4%); Portland, Ore. (-30.5%); Sacramento (-30.3%); and Milwaukee (-30.3%).
- New listings of homes for sale fell 24.1% year over year, one of the biggest declines since May 2020.
- New listings declined in all metros Redfin analyzed. They fell most in Seattle (-41.7% YoY), Las Vegas (-41.5%), San Diego (-39.7%), Oakland (-39.5%) and Anaheim, Calif. (-38.3%).
- Active listings (the number of homes listed for sale at any point during the period) were down 0.9% from a year earlier, the first decline in 12 months. Active listings also fell slightly (about -0.3%) from a month earlier; typically, they post month-over-month increases at this time of year.
- Months of supply — calculated by the number of months it would take for the current inventory to sell at the current sales pace — was 2.6 months, up from 2 months a year earlier. Four to five months of supply is considered balanced, with a lower number indicating seller’s market conditions.
- Of the homes that went under contract, 34.7% had an accepted offer within the first two weeks on the market, down from 41% a year earlier but up from 33% a month earlier.
- Homes that sold were on the market for a median of 30 days, the shortest span since September. That’s up from a near-record low of 19 days a year earlier.
- Of the homes sold, 33.9% sold above their final list price. That’s the highest share since September but is down from 54% a year earlier.
- On average, 5.2% of homes for sale each week had a price drop, up from 3.7% a year earlier.
- The average sale-to-list price ratio, which measures how close homes are selling to their final asking prices, was 99.6%. That’s the highest level since August but is down from 102.6% a year earlier.