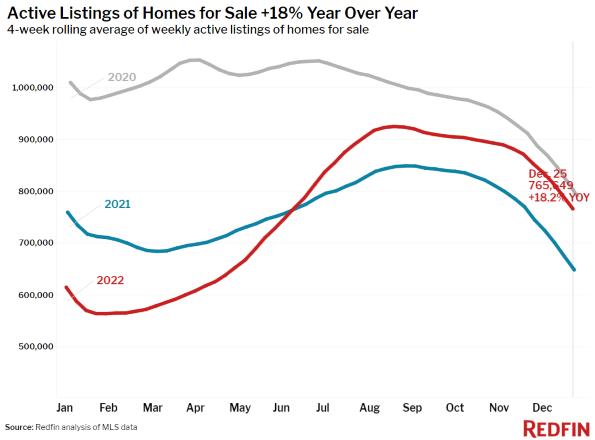
The number of homes for sale spiked 18% from a year earlier during the four weeks ended Dec. 25, 2022 the biggest increase since at least 2015, according to a report from Redfin.
The technology-powered brokerage said inventory has increased even though new listings are down by double digits because homes are taking a long time to sell amid 6%-plus mortgage rates — the average 30-year rate ticked up to 6.42% this week — economic uncertainty, and the typically slow holiday sales season.
The typical home was on the market for 40 days before going under contract, more than double the record-low 18 days set in May 2022 and the slowest pace since January 2021, Redfin said. Just over a quarter (28%) of homes went under contract within two weeks, the lowest share since January 2020.
Some buyers are returning to the market, because they can take their time searching. Redfin’s Homebuyer Demand Index — a measure of requests for tours and other Redfin buying services — is up 14% from its October low, the company said. Still, Redfin said it doesn’t expect sales to increase until well into January.
"This week's mortgage-rate pop can be chocked up to a handful of factors, but the week between Christmas and New Years is typically the slowest of the year for pending sales," said Redfin Deputy Chief Economist Taylor Marr. "We'll know more about the direction of rates and whether the recent uptick in early-stage demand will translate into sales when we're settled into the new year."
Sale Prices Falling
Home-sale prices fell year over year in 17 of the 50 most populous U.S. metros during the four weeks ending Dec. 25.
Prices fell 9% year over year in San Francisco; 6.5% in San Jose, Calif.; 6% in Los Angeles; 4.5% in Detroit; 4.4% in Pittsburgh; 3.7% in Sacramento, Calif.; 3.6% in Oakland, Calif.; and 2.3% in Austin, Texas. They fell 2% or less in New York; Seattle; Anaheim, Calif.; Phoenix; Chicago; Newark, N.J.; Riverside, Calif.; Boston; and Washington, D.C.
It marked the first time Boston prices have fallen since at least 2015, as far back as Redfin’s data goes. It’s the first time Washington, D.C. prices have fallen since 2016.
Leading indicators of homebuying activity:
- For the week ended Dec. 29, 30-year mortgage rates ticked up to 6.42%, the first increase after six weeks of declines. The daily average was 6.55% on Dec. 29.
- Mortgage purchase applications during the week ended Dec. 21 — the most recent period for which this data is available — were essentially flat from a week earlier and up 4.6% from a month earlier, seasonally adjusted. Purchase applications were down 36% from a year earlier.
- The seasonally adjusted Redfin Homebuyer Demand Index was up slightly from a week earlier and up 10% from a month earlier during the four weeks ended Dec. 25. It was down 20% from a year earlier.
- Google searches for “homes for sale” were on par with the previous month during the week ended Dec. 24, but down about 38% from a year earlier.
- Touring activity as of Dec. 25 was down 69% from the start of the year, compared to a 58% decrease at the same time last year, according to home tour technology company ShowingTime. The significant declines are likely due to the holidays.
Key Housing Market Takeaways
Unless otherwise noted, this data covers the four-week period ended Dec. 25. Redfin’s weekly housing market data goes back through 2015.
- The median home sale price was $351,860, up just 0.7% year over year, the slowest growth rate since the start of the pandemic.
- The median asking price of newly listed homes was $349,950, up 3% year over year, the slowest growth rate since the start of the pandemic.
- The monthly mortgage payment on the median-asking-price home was $2,265 at the current 6.42% mortgage rate. That’s up slightly from a week earlier but down $254 from the October peak. Monthly mortgage payments are up 36.7% from a year ago.
- Pending home sales were down 31.8% year over year, one of the largest declines since at least January 2015, as far back as this data goes.
- Among the 50 most populous U.S. metros, pending sales fell the most from a year earlier in Las Vegas (-62.7%); Austin (-57.3%); Phoenix (-56.9%); Jacksonville, Fla. (-55.6%); and Portland, Ore. (-52.2%).
- New listings of homes for sale were down 21.6% from a year earlier, one of the largest declines since the start of the pandemic.
- Active listings (the number of homes listed for sale at any point during the period) were up 18.2% from a year earlier, the biggest annual increase since at least 2015.
- Months of supply — a measure of the balance between supply and demand, calculated by dividing the number of active listings by closed sales — was 3.3 months, down from a week earlier but up from 1.8 months a year earlier.
- 28% of homes that went under contract had an accepted offer within the first two weeks on the market, down from 35% a year earlier and the lowest share since January 2020.
- Homes that sold were on the market for a median of 40 days, up more than a week from 30 days a year earlier and up from the record low of 18 days set in May.
- 23% of homes sold above their final list price, down from 41% a year earlier and the lowest level since March 2020.
- On average, 4.8% of homes for sale each week had a price drop, down sharply from 6% a month earlier. It’s up from 2.2% a year earlier.
- The average sale-to-list price ratio, which measures how close homes are selling to their final asking prices, fell to 98.1% from 100.2% a year earlier. That’s the lowest level since March 2020.