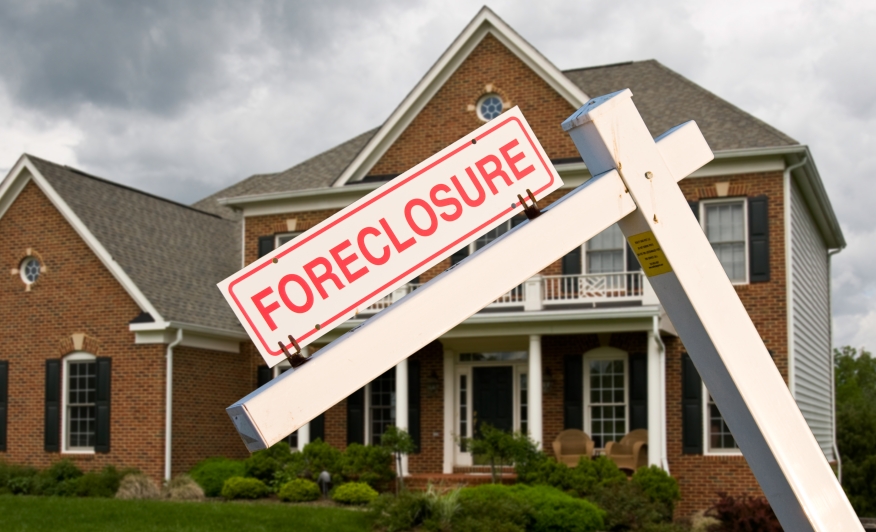
The U.S. housing market experienced a rise in foreclosure activity in February 2025, with filings increasing by 5% compared to the previous month, according to the latest U.S. Foreclosure Market Report released by ATTOM, a leading curator of property data and real estate analytics.
However, on an annual basis, foreclosure filings — which include default notices, scheduled auctions, and bank repossessions — declined by 1.7%.
A Market Under Pressure
"February's rise in foreclosure filings suggests evolving market pressures," said Rob Barber, CEO at ATTOM. "While some increase may reflect seasonal trends, the uptick in foreclosure starts both month-over-month and year-over-year signals potential shifts. We'll continue monitoring how economic factors influence foreclosure activity moving forward."
Despite an overall rise in filings, completed foreclosures (also known as Real Estate Owned properties, or REOs) continued a downward trend, showing an 11% annual decrease. Lenders repossessed 3,031 properties in February, marking the 12th annual decline in the last 13 months.
States With The Sharpest Decline In Completed Foreclosures
First, the good news: Among states with at least 50 REOs, the steepest annual declines in repossessions were recorded in:
- New York (down 49%);
- South Carolina (down 44%);
- New Jersey (down 43%);
- Pennsylvania (down 35%); and
- Ohio (down 34%).
Meanwhile, metropolitan areas with the highest number of completed foreclosures included Chicago, Ill. (154 REOs), Houston, Texas (101 REOs), St. Louis, Mo. (91 REOs), Detroit, Mich. (87 REOs), and Philadelphia, Penn. (78 REOs).
Foreclosure Rates Highest In Delaware, Illinois, And Nevada
At a national level, one in every 4,395 housing units had a foreclosure filing in February. The states with the highest foreclosure rates were:
- Delaware (one in every 2,278 housing units);
- Illinois (one in every 2,333 housing units);
- Nevada (one in every 2,435 housing units);
- New Jersey (one in every 2,695 housing units); and
- South Carolina (one in every 2,816 housing units).
Among major metropolitan areas (population of 200,000 or more), Modesto, Calif. recorded the highest foreclosure rate, with one in every 1,486 housing units facing a foreclosure filing. Other cities with high foreclosure rates included Lakeland, Fla. (1 in 1,863 housing units), Columbia, S.C. (1 in 2,006 housing units), Chicago, Ill. (1 in 2,007 housing units), and Atlantic City, N.J. (1 in 2,032 housing units).
For larger metro areas (population over 1 million), the highest foreclosure rates were found in:
- Las Vegas, Nev. (one in every 2,044 housing units);
- Riverside, Calif. (one in every 2,166 housing units);
- Philadelphia, Penn. (one in every 2,195 housing units); and
- Jacksonville, Fla. (one in every 2,445 housing units).
Foreclosure Starts See Monthly And Annual Growth
A significant trend in February was the rise in foreclosure starts, with 22,730 properties entering the foreclosure process — an 8% increase from the previous month and a 1% increase from a year ago.
States with the most significant monthly increases in foreclosure starts included:
- New Jersey (+78%);
- Colorado (+58%);
- Iowa (+57%);
- Georgia (+42%); and
- South Carolina (+29%).
At the metro level, the cities with the highest number of foreclosure starts in February 2025 were:
- New York, N.Y. (1,387 foreclosure starts);
- Chicago, Ill. (1,367 foreclosure starts);
- Houston, Texas (1,050 foreclosure starts);
- Philadelphia, Penn. (743 foreclosure starts); and
- Dallas, Texas (651 foreclosure starts).