Economists in Washington, D.C. have determined that the most expensive housing market in the U.S. can be found in, of all places, right outside of their offices.
In a Bureau of Labor Statistics (BLS) report titled “Housing: Before, During, and After the Great Recession,” the nation’s capital was named the costliest metropolitan housing market, with residents spending an average of $28,416 on housing. Out of the $28,416 spent on D.C.-area housing costs, $17,603 goes directly toward shelter, with the remaining funds are divided between utilities and public services, household operations, housekeeping supplies and household furnishings and equipment. In comparison, the national average on shelter costs is $9,891.
San Francisco was listed as the second most expensive housing market, followed in order by New York City, San Diego, Baltimore, Los Angeles, Seattle, Boston, Philadelphia and Chicago. At the other end of the spectrum, households in areas markets as Cleveland, Miami and Detroit, spent, on average, less on housing than the national average. The study used 2012 data to reach its conclusions.
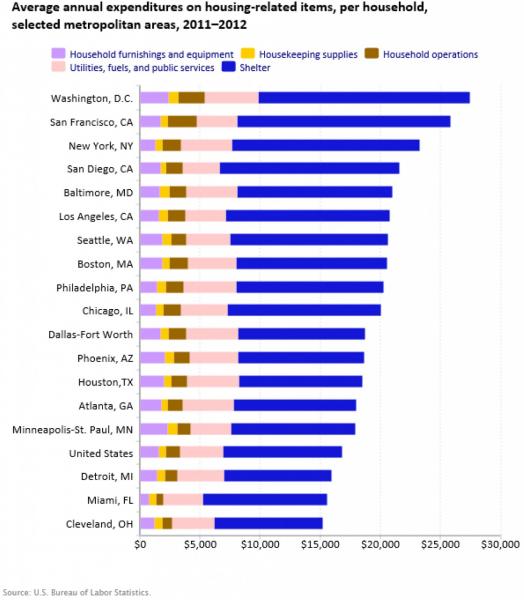
“In 2012, households spent the largest share of average annual expenditures (33 percent, or $16,887) on housing,” said economist Demetrio M. Scopelliti, author of the study. “As a percentage of total housing expenditures, households spent, on average, most on shelter (59 percent). Over 60 percent of expenditures on shelter were on owned dwellings—consisting of mortgage interest and charges ($3,067), property taxes ($1,836), and maintenance, repairs, insurance, and other expenses ($1153). On average, slightly over 20 percent of total housing expenditures were spent on utilities, fuels, and public services.”
The survey also muddied the debate on whether homeownership is more cost effective than renting.
“In 2012, on average, homeowners spent less on mortgage interest and charges than renters spent on rent,” Scopelliti reported. “Renters, however, spent less on all other housing-related expenditures including maintenance, repairs, insurance, and other expenses, where homeowners spent $1,788, on average, while renters spent $13. Homeowners spent, on average, more than twice as much as renters on household furnishings and equipment.