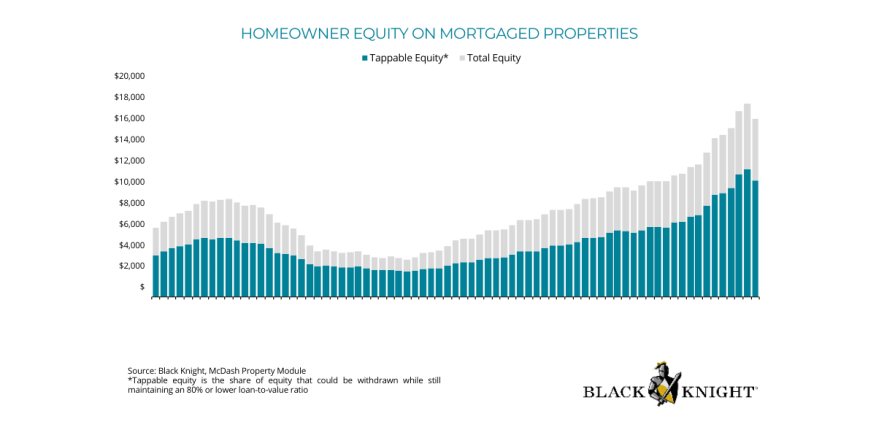
After peaking in the second quarter of this year, homeowner equity saw record levels of contraction in the third quarter of 2022, according to Black Knight’s Mortgage Monitor Report, released Monday.
Equity among mortgaged homes is now nearly $1.5 trillion, or -8.4%, off its May 2022 peak, with the equity of the average borrower down $30,000 from earlier this year. However, equity positions remain strong, at 46% above pre-pandemic levels, with the average mortgage-holder having more than $92,000 more equity than before.
The report found that $1.3 trillion (7.6%) in equity vanished from the market in the third quarter as prices pulled back, the largest quarterly dollar decline on record.
“In the span of just three months, U.S. mortgage holders saw a total of $1.3 trillion in newly acquired equity evaporate,” said Ben Graboske, president of Black Knight Data & Analytics. “That is — by far — the largest quarterly decline on record by dollar value and the largest since 2009 on a percentage basis. As we reported at the time, while hitting a record high in the second quarter, total homeowner equity peaked mid-quarter in May and has been pulling back ever since."
"All in," he continued, "equity among mortgaged properties is now down nearly $1.5 trillion since that point. From a risk perspective, we’ve already seen the number of underwater borrowers more than double alongside the equity pullback. That said, it’s important to note that — even with 275,000 falling underwater since May — fewer than half a million homeowners owe more on their homes than their current values. Historically speaking, that is still extremely low.”
Aside from equity, this month’s Mortgage Monitor focused on underwater homes. The report showed that although the number of underwater homeowners has climbed nearly 275,000 over the past four months, fewer than 500,000 homes are currently underwater nationwide. Nationally, 3.6% of borrowers are either underwater or have less than 10% equity, roughly half the pre-pandemic share; a historically and extremely low share (0.84%) are in negative equity positions.
The report also noted that median home prices fell 0.52% in September, continuing a three-month streak of declines — but at half the pace of the prior two months.
Eight markets saw home values decline by 1% or more in September, bringing the total pullback from peaks to more than 5% for a quarter of the top 50 markets. Nationally, homes shed 2.6% of their value over the past three months, Black Knight said.
In 10% of major markets — including Las Vegas, Miami, and Los Angeles, among others — it requires twice the normal share of median household income to make the payment on the average home purchase. All in all, prices have fallen 2.6% since June, the first three-month decline since 30-year rates spiked to nearly 5% back in late 2018.
The national delinquency rate inched down 1 basis point in September to 2.78%, just 3 basis points off the record low set in May of this year. The number of borrowers with a single payment past due rose by 1%, while 90-day delinquencies fell 1.5% in September and are now only 24% above pre-pandemic levels.
Foreclosure starts declined by 9% to 18.4K, holding the line at 3% of serious delinquenciesin September, down slightly month over month and less than half of pre-pandemic levels.
Other report insights can be found here.