Home prices rose in January at the fastest annual rate since 2022, according to the updated S&P CoreLogic Case-Shiller U.S. National Home Price NSA Index and the Federal Housing Finance Agency's (FHFA) seasonally adjusted monthly Home Price Index (HPI), each released Tuesday.
The S&P CoreLogic Case-Schiller index shows January home prices rose 6% year-over-year, up from the 5.6% logged in December. Meanwhile, the FHFA reported a 6.3% rise in year-over-year home price growth to start the year.
Both indices recorded a slight, 0.1% monthly decrease from December to January.
In a press release, Dr. Anju Vajja, acting deputy director for the FHFA’s Division of Research and Statistics, noted the monthly decline was the first since August 2022. “However," she said, "the year-over-year house price growth remained near the historical average.”
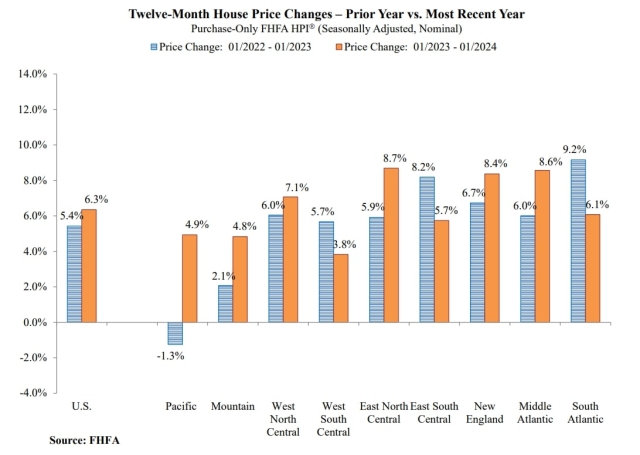
Of the nine census divisions that the FHFA's HPI tracks, the most robust annual home price growth occurred in the East North Central (+8.7%), Middle Atlantic (+8.6%), New England (+8.4%), and West North Central (+7.1%) divisions.
The South Atlantic, East South Central, and West South Central divisions all saw greater annual home price growth from January 2022 to January 2023 than January 2023 to January 2024, as the chart below depicts.
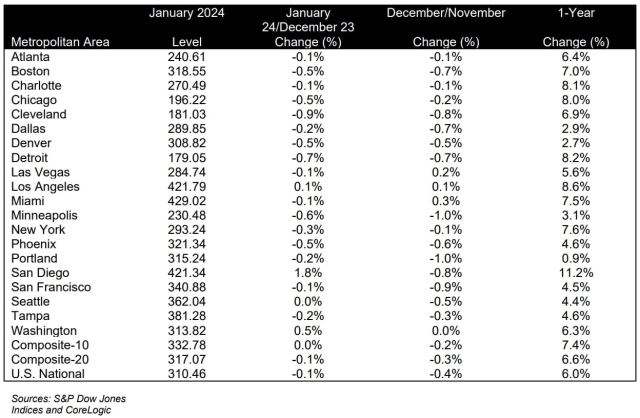
CoreLogic's 10- and 20-City Composite indices show that January home price growth in major metros exceeded the national rate, rising 7.4% and 6.6%, respectively. All cities reported increases in annual prices for the second consecutive month, with San Diego surging 11.2%, according to the Index.
“We’ve commented on how consistent each market performed during 2023 and that continues to be the case," Brian D. Luke, head of commodities, real and digital assets at S&P Dow Jones Indices, said in a press release. "While there is a large disparity between leaders such as San Diego versus laggards such as with Portland, the broad market performance is tightly bunched up. This is also true of high and low tiers. The average annual gains between high and low tiers across cities tracked by the indices is just 1.1%."
Low-priced indices have outperformed high-priced indices for 17 months. These data indicate that most homeowners experienced "healthy gains in the last year, no matter what city you were in, or if it was in an expensive or inexpensive market," Luke continued.
That being said, Luke cited elevated borrowing costs as causing home prices in 17 markets to decline from December to January. Minneapolis, for example, has posted a 2.4% home price decline for the three months prior to January. Only San Diego (+1.8%), Los Angeles (+0.1%), and Washington, D.C. (+0.5%) experienced monthly home price gains to kick off 2024.
Offering a forward-looking perspective on the January update, Corelogic Chief Economist Dr. Selma Hepp said that with the arrival of spring, "home prices are likely to show a seasonal uptick, although the annual acceleration in gains will slow compared with the strong 2023 spring. Nevertheless, more inventory is a welcome development and suggests that some normalization in the U.S. housing market lies ahead.”
Echoing S&P Dow Jones's Luke, she also referenced high borrowing costs as impacting start-of-the-year housing activity. “While elevated mortgage rates continued to freeze housing market activity over the winter," Hepp said, "an unthawing is in sight, with improvements in for-sale inventory offering more opportunities for potential buyers across the country.”
A total of 1.07 million housing units were for sale at the end of February, according to the National Association of Realtors (NAR), a 5.9% increase from January and a 10.3% increase over last year. Recent NAR data show existing-home sales jumped 9.5% in February.
NAR Chief Economist Lawrence Yun cited improved inventory, alongside population and job growth, as reasons for the rise. February existing-home sales still sat 3.3% lower year-over-year, though.
Meanwhile, new data from Redfin shows the total number of homes for sale saw a 5% incline during the four weeks ending March 17, the largest year-over-year increase since May 2023. New listings surged 15% – the largest increase since June 2021.
Though the arrival of more inventory has drawn buyers to the market, it has done little to cool home price appreciation. As of mid-March, the median sales price was up 5.3% year-over-year, Redfin reports, marking the second biggest increase since October 2022.