Data released today by the Federal Housing Financing Agency (FHFA) hints at cooling of housing prices after a year of stratospheric increases. The FHFA’s seasonally adjusted monthly index for March was up 1.5% from February.
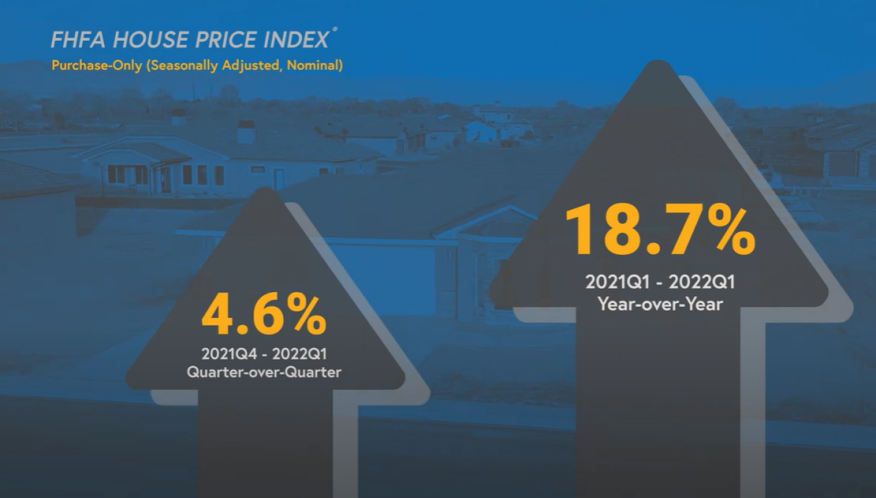
The FHFA’s House Price Index shows U.S. house prices rose 18.7% from the first quarter of 2021 to the first quarter of 2022, but began to cool toward the end of the first quarter. An FHFA economist says numbers grew even softer in April.
"High appreciation rates continued across housing markets during the first quarter of 2022," said William Doerner, Ph.D., supervisory economist in FHFA's Division of Research and Statistics. "Strong demand coupled with tight supply have kept prices climbing. Through the end of March, higher mortgage rates have not yet translated into slower price gains, but new home sales have dropped during the last few months, with a significant falloff in April."
Doerner said other economic indicators also suggest a potential softening, with a growing number of real estate listings where prices have been reduced. “Demand still remains relatively high as we head into the summer buying season,” he said.
There have been 41 straight quarters of increases in FHFA's house price index. House prices haven’t declined since 2012.
The FHFA HPI is the nation’s only collection of public, freely available house price indexes that measure changes in single-family home values based on data from all 50 states and over 400 American cities that extend back to the mid-1970s. The FHFA HPI incorporates tens of millions of home sales and offers insights about house price fluctuations at the national, census division, state, metro area, county, ZIP code, and census tract levels. FHFA uses a fully transparent methodology based upon a weighted, repeat-sales statistical technique to analyze house price transaction data.
FHFA releases HPI data and reports on a quarterly and monthly basis. The flagship FHFA HPI uses seasonally adjusted, purchase-only data from Fannie Mae and Freddie Mac. Additional indexes use other data, including refinances, FHA mortgages, and real property records.
All the indexes, including their historic values, and information about future HPI release dates are available on FHFA’s website.