Mortgage lenders have a competitor in a new tool fashioned by one of their own.
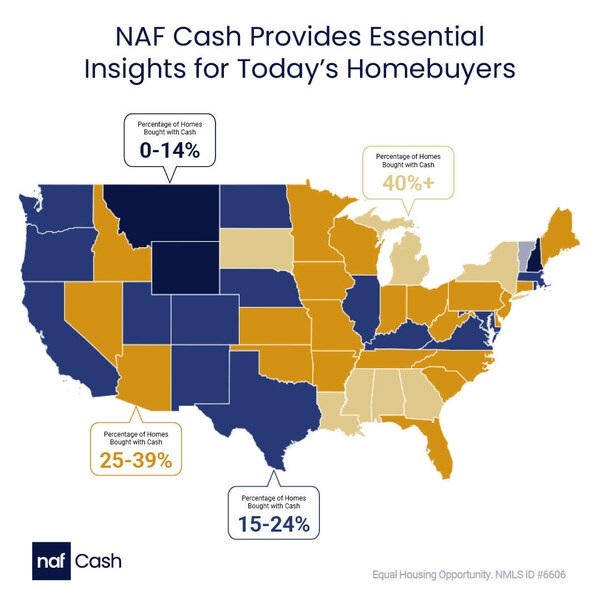
NAF Cash, an affiliate of New American Funding (NAF), just introduced NAF Cash Maps, an analytics tool that harnesses MLS data, public records and more to paint a picture of homebuyers’ cash transactions in each U.S. state.
Aside from the visual analytics tool - the way the program works, the lender purchases a buyers’ desired home in cash on their behalf, allowing them to buy it back at their preferred pace - with interest - while selling their existing home. The buyer has an advantage in that all-cash deals have tended to win the bidding wars of recent years, when competition was high.
NAF Cash Maps appears to have distinguished itself from other cash-offer companies - including the Austin-based real estate startup Homeward, along with Ribbon, Knock, Opendoor, and Flyhomes - with its mapping features and analytics. The creators say the new tool can empower buyers to make more informed decisions about how to compete in today's housing market.
"We're thrilled to introduce NAF Cash Maps, a groundbreaking tool that provides homebuyers with invaluable insights into the real estate market," NAF Cash Director Miguel Villegas said. "By understanding the cash buying trends in different states, homebuyers can make more strategic decisions and position themselves for success in their home buying journey. By leveraging NAF Cash to become a cash buyer, first-time and repeat homebuyers can position themselves as serious contenders, increasing their chances of acceptance and success. Buying in cash may also help save money, as some home sellers are willing to accept a lower price due to the certainty of a cash transaction over the chance that the buyer's mortgage falls through.”
NAF Cash Maps has served more than 1,000 homebuyers since its launch, according to the lender. Program users have taken to online forums to discuss their experiences.
“The way NAF is making money off of this is a form of service/finance charge added onto the loan amount you are financing (rate dependent on state),” a user to Reddit wrote. “NAF purchases the home and is contracted to sell it back to you when you are prepared to perform the ‘buy back.’ In addition, on day one of purchase that you can move into the house, you're going to be charged $60/day in ‘rent’ which will net out to about $1,800/month until you perform your buy back. This will be invoiced to you either at the time of your buy back, or at the end of the 90 day period described below.”
The person goes on to describe paying a lease to NAF for 90 days, after which 10% is added per month the buy back goes uncompleted.
“My wife and I are comfortable with NAF's monetization of this product,” the user goes on to say. “We can consider the $5,000+ rent to be a form of convenience charge to snatch a house that has come on the market before our house has had a chance to sell.”
A 2021 study by Redfin indicated that waiving the financing contingency is the second-most effective bidding-war strategy, improving homebuyers’ odds of winning by 66%. In January the National Association of Realtors (NAR) reported that 32% of home sales were made by buyers paying in cash.
Mississippi, Louisiana, Michigan, New York, South Carolina, and Alabama consistently rank among the leaders in cash as a percentage of total transactions. For the first quarter of this year, Mississippi ranked first in the nation in popularity of all-cash homebuying, with more than half of all home purchases (56%) made in cash. Also ranking high on the list of cash buying prevalence is Louisiana, which ranked second in the U.S. (53%), just above Michigan (51%). Rounding out the top 5 in Q1 2024 were Georgia (47%) and New York (44%).