Sales of newly constructed homes increased a startling 7% in January, the second consecutive monthly increase. Sales rose to their highest level in 10 months.
The U.S. Census Bureau and U.S. Department of Housing and Urban Development on Friday jointly released the latest data on new home sales, which far surpassed analysts’ expectations of a 0.7% increase from December.
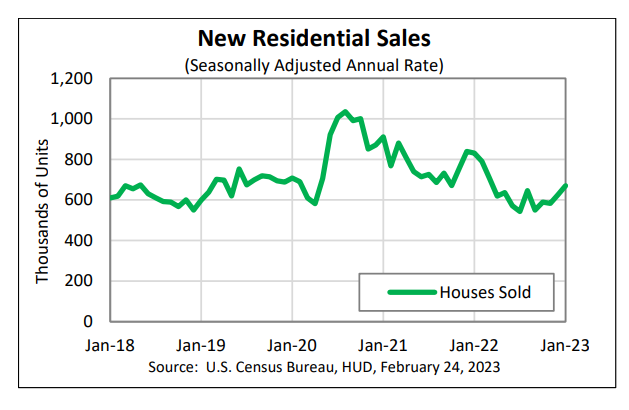
According to the report, sales of new single-family houses in January were at a seasonally adjusted annual rate of 670,000, up 7.2% from the revised December rate of 625,000. The January estimate, however, is still down 19.4% from the January 2022 estimate of 831,000.
January’s surge was led predominantly by sales in the South, which rose 17.1% from December. Sales fell month over month in the other three U.S. regions, and were down year over year in all four areas.
The January annual rate of 670,000 is the highest since the March 2022 estimate of 707,000, according to the report.
January’s unexpectedly large increase in sales came despite rising mortgage rates and the continued decline in sales of existing homes, which fell in January for the 12 straight month.
In addition, the median sales price of new houses sold in January 2023 was $427,500, down $$38,100, or 8%, from the December median price of $465,600. January’s median sales price is the lowest since it was $427,400 in February of last year. The median price means half of the homes were sold for more and half for less.
The average sales price was $474,400, down $69,800 from December, a 12% drop. It was the lowest average price since June 2022.
The seasonally‐adjusted estimate of new houses for sale at the end of January was 439,000, equal to a supply of 7.9 months at the current sales rate. That was down from 452,000 in December and marked the third straight monthly decline.
By region, sales in January fell from December in the Northeast (-19.4%), the West (-7.3), and the Midwest (-6.9%), but jumped 17.1% in the South. Year-over-year, sales were down in all four regions, led by the West at -46.9%. Sales also fell YOY in the Midwest (-34.3%), Northeast (-13.8%), and the South (-2.2%).
The jump in existing-home sales may be related to builders offering incentives, including mortgage rate buydowns. Black Knight reported earlier this month that 6 in 10 homebuyers in January paid at least a half-point to permanently lock in a lower mortgage rate.
In addition, the National Association of Home Builders said in December that 36% of single-family home builders reported reducing their prices in November, while 59% offered sale incentives, including price discounts or free upgrades, as well as mortgage rate buydowns.
Odeta Kushi, deputy chief economist for First American Financial Corp., said via Twitter that "builders use incentives to bolster sales; rate buydowns, paying points & offering price reductions, but also offering upgrades on appliances & other quality features, essentially giving the buyer more home for the same amount of $ that they had originally contracted for."
"Not to mention," she added, "that the inventory of existing homes for sale remains very low, and a new home, at the right prices, is a very good substitute."