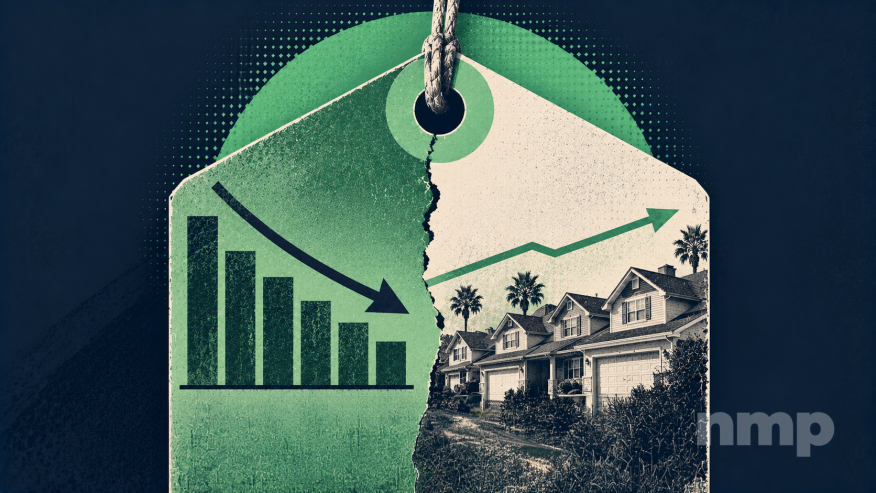
California’s existing-home market is losing transactions without delivering much price relief to buyers, leaving loan originators competing for fewer purchases while affordability remains constrained.
Sales of existing single-family detached homes fell 6.5% from a year earlier in September and 3.4% from August, according to the California Association of Realtors’ latest report, released Oct. 19. The statewide median price, meanwhile, rose 1.7% annually to $899,720, slipping just 0.2% from August.
The seasonally adjusted annualized sales pace reached 260,410, marking the 48th consecutive month below 300,000. That figure represents the annual sales pace implied by September’s activity, adjusted for seasonal patterns, rather than the number of homes sold during the month.
For purchase-focused originators, the combination leaves two constraints in place: fewer completed transactions and home prices that remain elevated even as demand weakens.
More Inventory, Few Signs Of A Seller Influx
Active listings increased 2.7% from August and 0.5% from a year earlier, their first annual increase in eight months. But C.A.R. attributed the growth primarily to the pullback in sales rather than a meaningful increase in new listings.
The association’s Unsold Inventory Index stood at 3.7 months, unchanged from August and slightly above 3.6 months a year earlier.
“On the supply side, the mortgage rate lock-in effect continues to constrain new listings, while limited inventory is helping to cushion home prices against weaker demand,” C.A.R. Senior Vice President and Chief Economist Jordan Levine said in the release.
“These competing forces suggest that slower sales may not translate into a comparable decline in prices in the near term.”
The distinction has a practical implication for lenders: a larger pool of active listings does not necessarily signal more homeowners preparing to sell and finance their next purchase. Some of that inventory reflects homes that buyers have yet to absorb.
Slower Sales Do Not Mean Every Seller Is Yielding
Other measures complicate a broad claim that California buyers have gained negotiating power.
Homes that sold took a statewide median of 29 days to sell, up from 28 in August but down from 32 a year earlier. The statewide sale-to-original-list-price ratio was 98.8%, compared with 98.2% in September 2025.
Those measures describe completed sales, not every property still on the market. Even so, they show why a decline in transaction volume should not be treated as evidence that all sellers are accepting larger discounts.
The statewide median also reflects the mix of properties changing hands. Million-dollar homes accounted for 35.9% of September sales, up from 35.2% in August. C.A.R. said the larger share of higher-priced sales helped limit the median’s monthly decline.
That does not establish that individual homes appreciated or that the number of million-dollar transactions increased. The median price per square foot also rose, increasing 1.6% annually to $434.
California’s Negotiating Room Depends On The Market
Regional results offer a more useful starting point for borrower conversations than the statewide sales decline alone.
California Markets At A Glance
September 2026 existing single-family home marketMeasure | San Francisco Bay Area | Inland Empire |
|---|
Sales change from September 2025 | −3.1% | −10.2% |
|---|
Median sale price | $1,325,000 | $601,030 |
|---|
Months of unsold inventory | 2.6 | 4.7 |
|---|
Median time on market | 19 days | 41 days |
|---|
Source: California Association of Realtors. Regional sales changes are not seasonally adjusted.
The Bay Area’s median selling time shortened from 24 days a year earlier, while the Inland Empire’s increased from 39 days. Across Southern California, sales fell 9.1% annually even as the regional median price increased 3%.
For LOs, those differences support property-specific financing discussions. Where sellers are willing to negotiate, comparing a price reduction with allowable seller-paid closing costs or a permanent rate buydown can show borrowers how each option affects their cash needs and monthly payment.
Pending Sales Point To Further Pipeline Pressure
September’s closings also provide a backward-looking measure of demand. Levine said a decline in pending sales suggests further softening in closed transactions in the coming months, although the release did not quantify that pending-sales decline.
Separate data covered in NMP’s recent report on sellers outnumbering buyers showed September pending sales fell 16% annually in Los Angeles, 15.8% in San Diego, and 15.5% in Anaheim.
The financing environment has also shifted from the conditions behind California’s first-quarter affordability improvement. That earlier C.A.R. report found that lower rates and softer prices helped 22% of households afford a median-priced single-family home.
September’s sales report shows that the average 30-year fixed rate rose to 6.86%, from 6.67% in August and 6.35% a year earlier, according to C.A.R.’s calculations using Freddie Mac survey data.
For California originators, the immediate opportunity is to identify where a specific seller’s flexibility can improve a borrower’s financing position. Falling statewide sales have yet to deliver broad price relief.