Despite a slight dip in interest rates compared to May, purchase lock volume declined for the second consecutive month in June, dropping 8% year over year according to Optimal Blue’s monthly Market Advantage data report, which leverages lenders’ rate lock data to provide insights into emerging market trends via early-stage origination activity.
Purchase locks declined 4% annually in May after rising year over year in April. The benchmark 30-year conforming rate ended June at 6.938%, eight basis points lower than at the end of May. The dip in mortgage rates drove a 39% month-over-month increase in rate-and-term refinances.
Total rate lock volume rose 2% monthly in June, on account of the jump in refinance volume, and adjusting for fewer market days than in April. Purchases comprised 84% of June’s total lock volume, a 1% dip from May, while refinances comprised 16%. Cash-out lock volume rose 11%.
In the top-20 metropolitan statistical areas (MSAs) by origination lock volume, the largest gulf between locked loans’ purpose was in Houston, where purchases represented 93%, and refinances, 7%, of June lock volume, followed by Austin, at 92% and 8%, respectively.
The MSAs with the greatest parity in loan purpose were Los Angeles, where purchases comprised 76%, and refinances, 24%, of June lock volume, followed by Miami and Riverside, at 79% and 21%, respectively.
Meanwhile, home prices declined for the first time this year in June, according to Optimal Blue’s tracking of average loan amounts, which dropped $300 from May, to $374,200. The average home purchase price ended a five-month growth streak, dropping from $480,300 to $478,800.
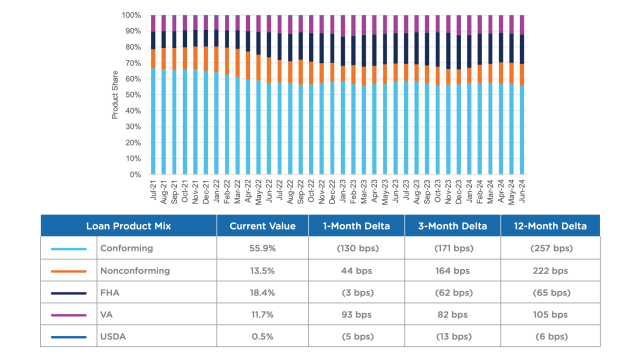
By loan product, conforming loan rate locks in June dropped 130 basis points month over month, and 257 basis points year over year, to comprise 55% of lock volume. Non-conforming rate locks rose 44 basis points from May, and 222 basis points annually, to comprise 13.5% of June lock volume. FHA locks comprised 18.4%, VA locks comprised 11.7%, and USDA, 0.5%.