Today’s non-qualified mortgage (Non-QM) landscape is growing, as more borrowers with limited documentation and high debt-to-income ratios seek home ownership.
Many of these borrowers offer a high credit score and lower loan-to-value (LTV) ratio, according to CoreLogic, which released a report about the state of Non-QM recently.
“While Non-QM loans constitute a small portion of the current mortgage landscape, they play a crucial role in serving borrowers who are unable to secure financing through GSEs or government channels,” wrote Archana Pradhan, principal, economist at the Office of the Chief Economist at CoreLogic. “These loans provide a valuable option for creditworthy borrowers, including self-employed individuals, gig economy workers, first-time homebuyers, borrowers with significant assets but limited income, jumbo loan borrowers, and investors.”
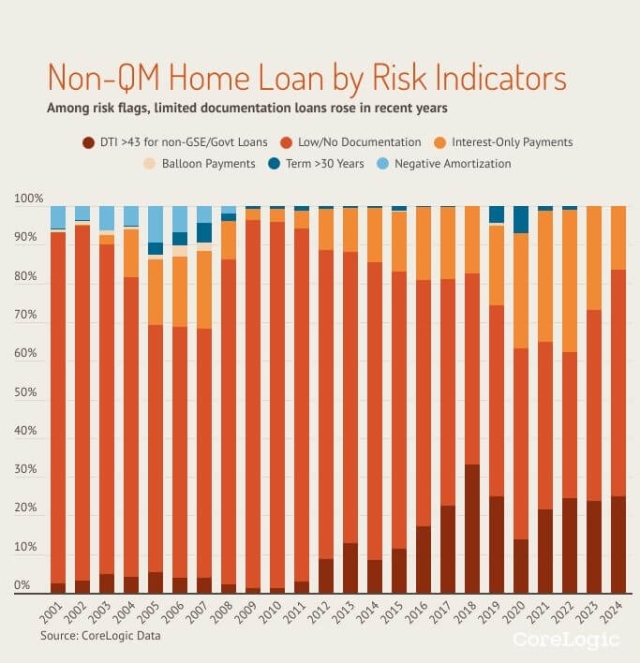
Figure 1 compares the Non-QM equivalent loans from 2001 to 2024 by composition of six major risk indicators. All home-purchase loans not meeting at least one of the six QM-mandated criteria are included.
It’s been a decade since the Consumer Financial Protection Bureau (CFPB) issued the regulations that set the stage for Non-QM; defining standards lenders must follow to determine loan applicants have the ability to repay (ATR) the mortgage.
Governed by the Dodd-Frank Wall Street Reform and the Consumer Protection Act, qualified (QM) loans must meet certain criteria regarding debt-to-income ratio, payment terms, and more.
“Despite the inherent risk in Non-QM loans, these loans have proven to be a valuable resource for creditworthy borrowers who do not qualify for traditional mortgage programs,” Pradhan pointed out. “Today’s Non-QM loans are of high quality and are considerably less risky than those originated prior to the Great Recession.”
The proportion of Non-QM loans with DTI ratios exceeding 43% increased by 12% from 2020 to 2024. The share of interest-only loans reduced by nearly half over the same period. Riskier factors that defined the first Non-QM products – including negative amortization and balloon payments – have since been eliminated.
While the Non-QM share of total mortgage counts declined to less than 3% in 2020, two years later it picked back up, going on to reach 5% of the total market share in 2024.
Non-QM loans issued so far in 2024 had the following characteristics: the use of limited or alternative documentation (62%); DTI (debt-to-income) ratios above 43% (26%); and interest-only loans (17%).
These loans tend to feature higher interest rates to offset the risks to the lender. In 2024, the average initial 30-year interest rate for Non-QM loans was 6.7%, compared to 6.4% for a qualified loan.
In 2024, the average credit score for Non-QM borrowers was 776, compared to 781 for conventional QM borrowers and 699 for government loan borrowers.
“Although the average DTI ratio for Non-QM borrowers was higher than that for QM borrowers, Non-QMs are performing well,” Pradhan said. “The average LTV ratio was 75% for both Non-QM and QM borrowers, while government loan borrowers had an average LTV of 97%.”